
As of June 2020, the coronavirus pandemic has led to more than 2.3 million confirmed infections and 121 thousand fatalities in the United States, with starkly different incidence by race and ethnicity. Our study examines racial and ethnic disparities in confirmed COVID-19 cases across six diverse cities – Atlanta, Baltimore, Chicago, New York City, San Diego, and St. Louis – at the ZIP code level (covering 436 “neighborhoods” with a population of 17.7 million). Our analysis links these outcomes to six separate data sources to control for demographics; housing; socioeconomic status; occupation; transportation modes; health care access; long-run opportunity, as measured by income mobility and incarceration rates; human mobility; and underlying population health. We find that the proportions of black and Hispanic residents in a ZIP code are both positively and statistically significantly associated with COVID-19 cases per capita. The magnitudes are sizeable for both black and Hispanic, but even larger for Hispanic. Although some of these disparities can be explained by differences in long-run opportunity, human mobility, and demographics, most of the disparities remain unexplained even after including an extensive list of covariates related to possible mechanisms. For two cities – Chicago and New York – we also examine COVID-19 fatalities, finding that differences in confirmed COVID-19 cases explain the majority of the observed disparities in fatalities. In other words, the higher death toll of COVID-19 in predominantly black and Hispanic communities mostly reflects higher case rates, rather than higher fatality rates for confirmed cases.
Inequality
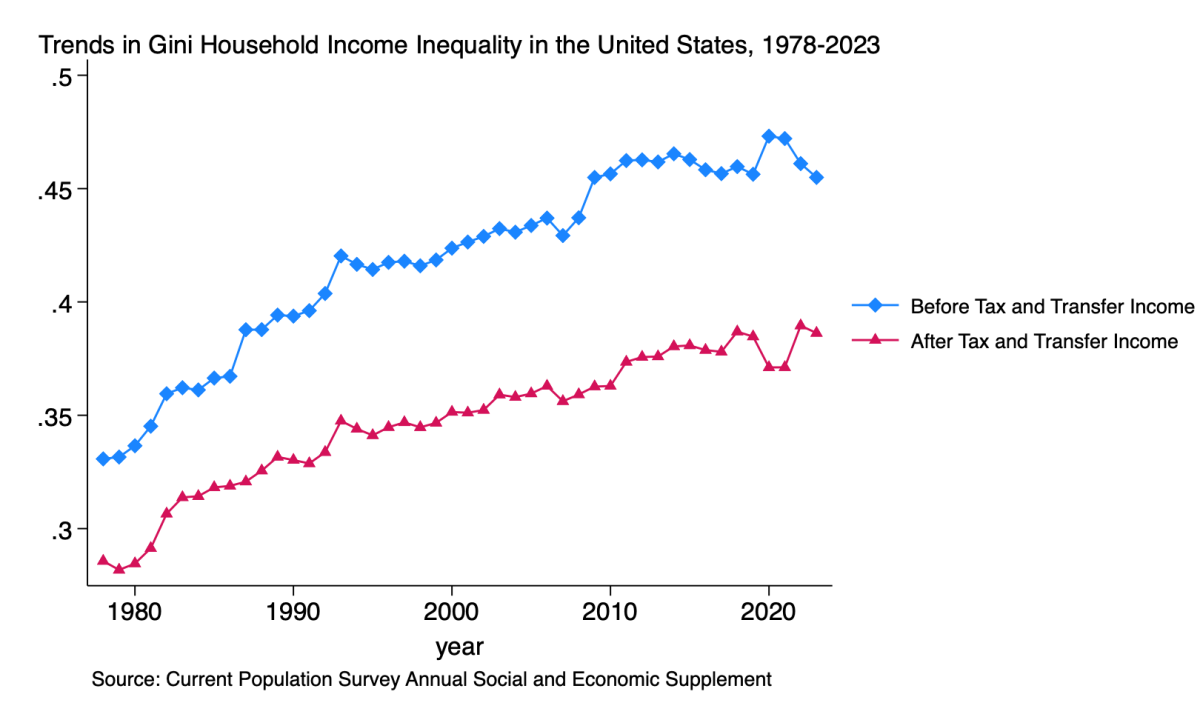 Understanding trends of rising inequality in the United States remains at the fore of both policy and research. As the figure makes clear, redistributive tax and transfer programs attenuate the level of inequality, but not the trend increase over time. Research by UKCPR affiliates Bradley Hardy and Elizabeth Krause, in collaboration with James Ziliak, explore some of the underlying mechanisms behind these developments, including changes in employment, wages, and household composition as part of the Deaton Inequality Country Studies project and published in Fiscal Studies .
2020
Trends in earnings volatility using linked administrative and survey data
We document trends in earnings volatility separately by gender in combination with other characteristics such as race, educational attainment, and employment status using unique linked survey and administrative data for the tax years spanning 1995-2015. We also decompose the variance of trend volatility into within- and between-group contributions, as well as transitory and permanent shocks. Our results for continuously working men suggest that trend earnings volatility was stable over our period in both survey and tax data, though with a substantial countercyclical business-cycle component. Trend earnings volatility among women declined over the period in both survey and administrative data, but unlike for men, there was no change over the Great Recession. The variance decompositions indicate that nonresponders, low-educated, racial minorities, and part-year workers have the greatest group specific earnings volatility, but with the exception of part-year workers, they contribute least to the level and trend of volatility owing to their small share of the population. There is evidence of stable transitory volatility, but rising permanent volatility over the past two decades in male and female earnings.
2018
EITC expansions, earnings growth, and inequality: Evidence from Washington, DC
We use longitudinal administrative tax data from Washington DC (DC) to study how EITC expansions undertaken by Washington DC affect income and inequality in the city. We find that DC EITC credit expansions between 2001 and 2009 are associated with recipient pre-tax earnings growth of roughly 3-4 percent, primarily among single mothers. Together these credits reduce post-tax inequality for the 10th percentile relative to median households. However, composition changes in the city and growing overall inequality mitigates this inequality reduction toward the end of the period. Overall, these results complement existing research showing that the EITC has a positive effect on labor market outcomes and household well-being.
Economic change and the social safety net: Are rural Americans still behind?
This aim of this paper is to assess the economic status of rural people five decades after publication of President Johnson's National Commission on Rural Poverty report The People Left Behind. Using data from the Annual Social and Economic Supplement of the CPS, along with county data from the Regional Economic Information System, I focus on how changes in employment, wages, and the social safety net have influenced the evolution of poverty and inequality in rural and urban places. The evidence shows that large numbers of rural Americans are disengaged from the labor market, gains in human capital attainment have stagnated, and the retreat from marriage continues for the medium- and less-skilled individuals. However, the social safety net has been more effective in redistributing income within rural areas than in urban centers. Work, education, and marriage are the three main pathways out of poverty for most Americans, whether residing in urban or rural locales, and thus making progress against poverty and inequality faces major economic and demographic headwinds.
2017
Income inequality and the labour market in Britain and the US
We study household income inequality in both Great Britain and the United States and the interplay between labour market earnings and the tax system. While both Britain and the US have witnessed secular increases in 90/10 male earnings inequality over the last three decades, this measure of inequality in net family income has declined in Britain while it has risen in the US. We study the interplay between labour market earnings in the family, assortative mating, the tax and benefit system and household income inequality. We find that both countries have witnessed sizeable changes in employment which have primarily occurred on the extensive margin in the US and on the intensive margin in Britain. Increases in the generosity of the welfare system in Britain played a key role in equalizing net income growth across the wage distribution whereas the relatively weak safety net available to non-workers in the US mean this growing group has seen particularly adverse developments in their net incomes.
2015
Trouble in the tails? What we know about earnings nonresponse 30 years after Lillard, Smith, and Welch
Earnings nonresponse in household surveys is widespread, yet there is limited evidence on whether and how nonresponse bias affects measured earnings. This paper examines the patterns and consequences of nonresponse using internal Current Population Survey individual records linked to administrative Social Security Administrative data on earnings for calendar years 2005-2010. Our findings confirm the conjecture by Lillard, Smith, and Welch (1986) that nonresponse across the earnings distribution is U-shaped. Left-tail “strugglers” and right-tail “stars” are least likely to report earnings. Household surveys understate earnings dispersion, reporting too few low and too few extremely high earners. Throughout much of the earnings distribution nonresponse is ignorable, but there exists trouble in the tails.
2014
Reassessing the effects of unemployment insurance generosity on search intensity: New evidence from earnings histories
This paper provides the first nationally representative estimates of how unemployment insurance (UI) generosity in the United States affects the search intensity of unemployed individuals using individual level variation in UI generosity. The paper expands the current literature through fully simulating monetary eligibility and entitlement to unemployment insurance at the individual level where past studies have been unable to examine monetary eligibility and have relied on state variations in the maximum weekly benefit amount which can differ significantly from an individual’s actual benefit amount. To simulate monetary eligibility and entitlement, work histories of unemployed respondents were obtained through fully matching American Time Use Survey respondents to all of their observations in the Current Population Survey, the population from which they are drawn. The results suggest that higher replacement rates are associated with large reductions in time spent searching for a job during normal economic conditions. However, the results are more mitigated during the Great Recession and post recession period with higher replacement rates being associated with small and statistically insignificant effects on time spent searching for a job, although these results appear to be partially driven by the years 2009 and 2010 which were at the height of the labor market decline.
2012
Is earnings non-response ignorable?
Earnings nonresponse in the Current Population Survey is roughly 30% in the monthly surveys and 20% in the March survey. If nonresponse is ignorable, unbiased estimates can be achieved by omitting nonrespondents. Little is known about whether CPS nonresponse is ignorable. Using sample frame measures to identify selection, we find clear-cut evidence among men but limited evidence among women for negative selection into response. Wage equation slope coefficients are affected little by selection but because of intercept shifts, wages for men and to a lesser extent women are understated, as are gender gaps. Selection is least severe among household heads.
Childhood Income Volatility and Adult Outcomes
Using data linked across generations in the Panel Study of Income Dynamics, I estimate the relationship between exposure to volatile income during childhood and a set of socioeconomic outcomes in adulthood. The empirical framework is an augmented intergenerational income mobility model that includes controls for income volatility. I measure income volatility at the family level in two ways. First, instability as measured by squared deviations around a family-specific mean, and then as percent changes of 25 percent or more. Volatility enters the model both separately and interacted with income level. I find that family income instability during childhood has a small, positive association with high school dropout–one which appears driven by volatility among children from lower income households. Evidence suggests that volatility exposure generally has a minimal impact on intergenerational outcomes relative to permanent income.
Decomposing trends in income volatility: The 'wild ride' at the top and bottom
We provide a detailed accounting of the trend increase in family income volatility in recent decades by quantifying the contributions of household head earnings, spouse earnings, non-transfer non-labor income, transfer income, and tax payments (inclusive of the refundable Earned Income Tax Credit), along with covariances among the income components. Using twoyear matched panels in the Current Population Survey from 1980 to 2009, we find that the volatility of family income, as measured by the variance of the arc percent change, doubled over the past three decades. The increase in volatility was most pronounced among the top 1% of the income distribution; however, in any given year the level of volatility among the bottom 10% exceeds that of the top. The variance decompositions indicate that increased family income volatility comes directly from the higher volatility of head and spouse earnings, and other non-labor income, as well as from substantially reduced covariance between these three income sources with the tax system. This suggests that the current tax code is less effective in mitigating income shocks than in previous decades. Among lower income households, a larger share of volatility is driven by transfer income. In the absence of the increased negative covariance between the volatility of head earnings with non-transfer other income, overall volatility would be much higher.